Wisecrop
Scattered farm tools rebuilt into one operating system

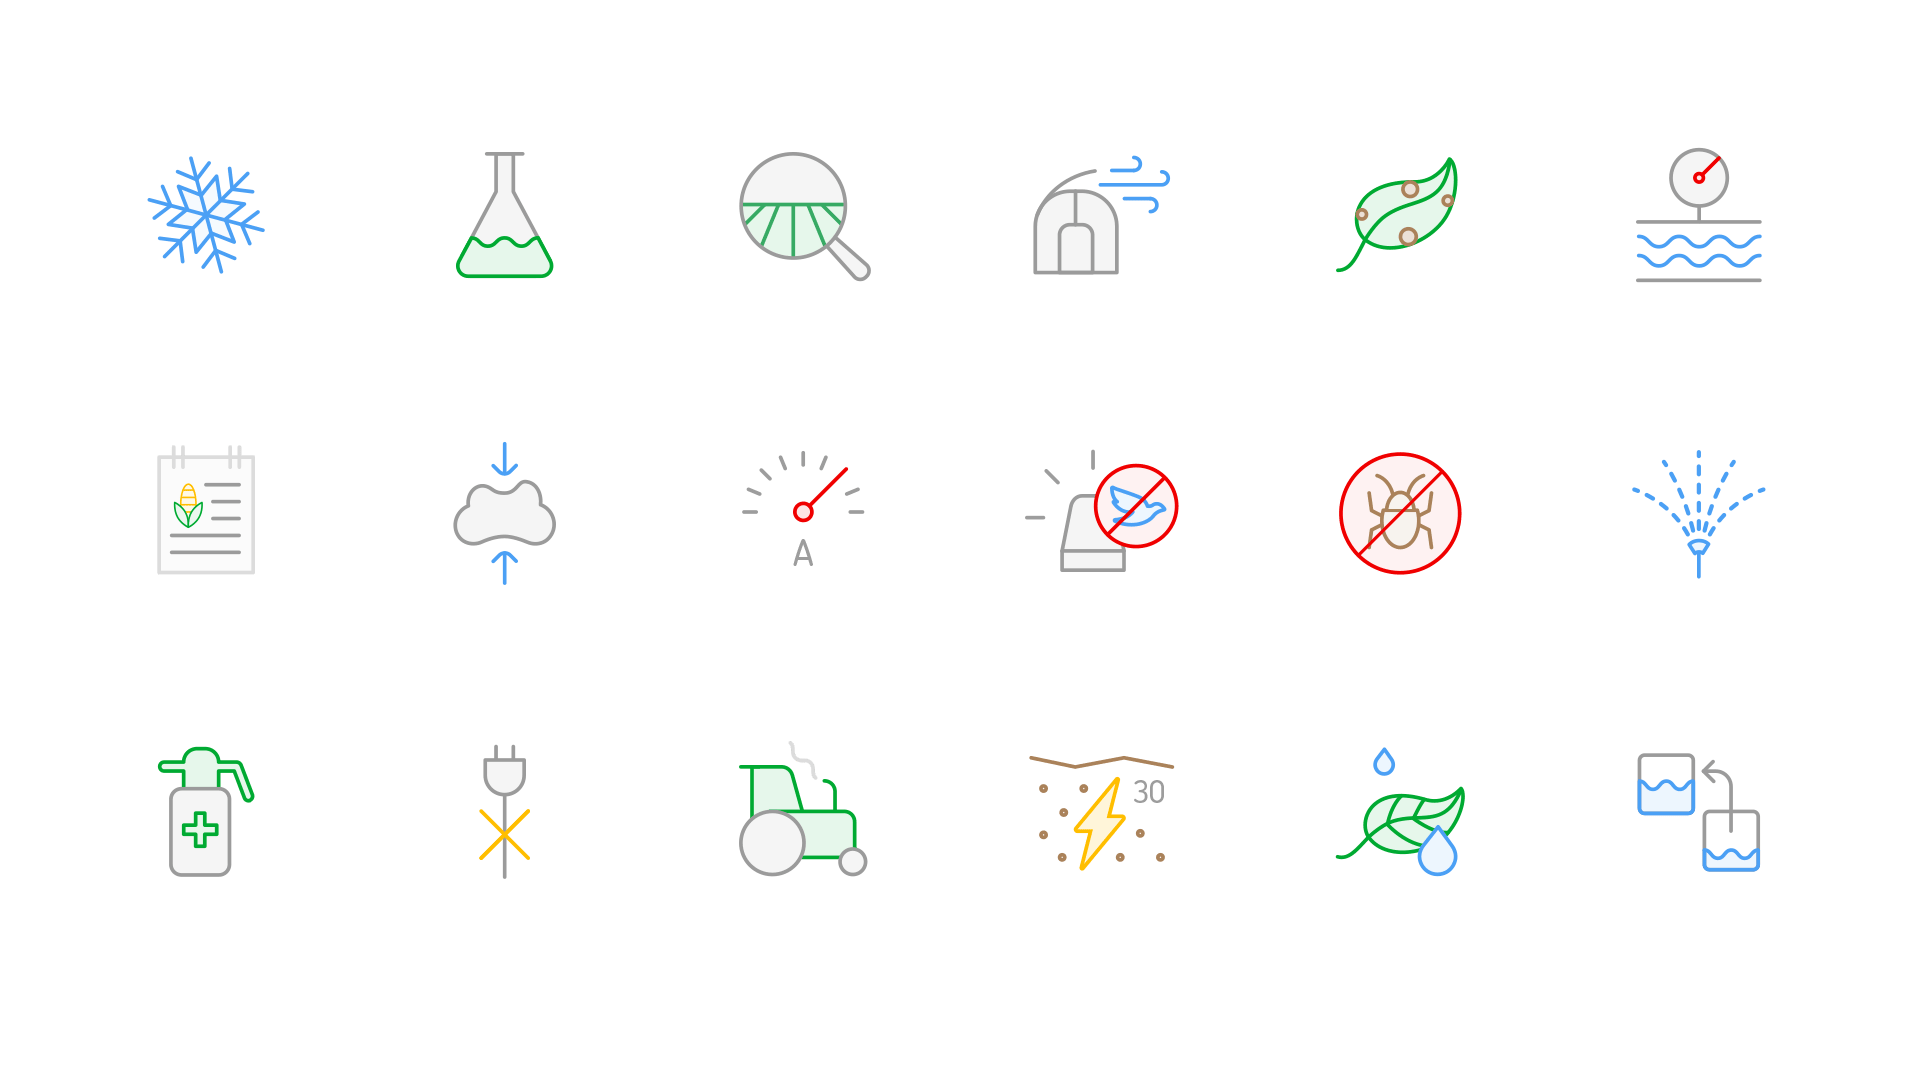
Modular Architecture
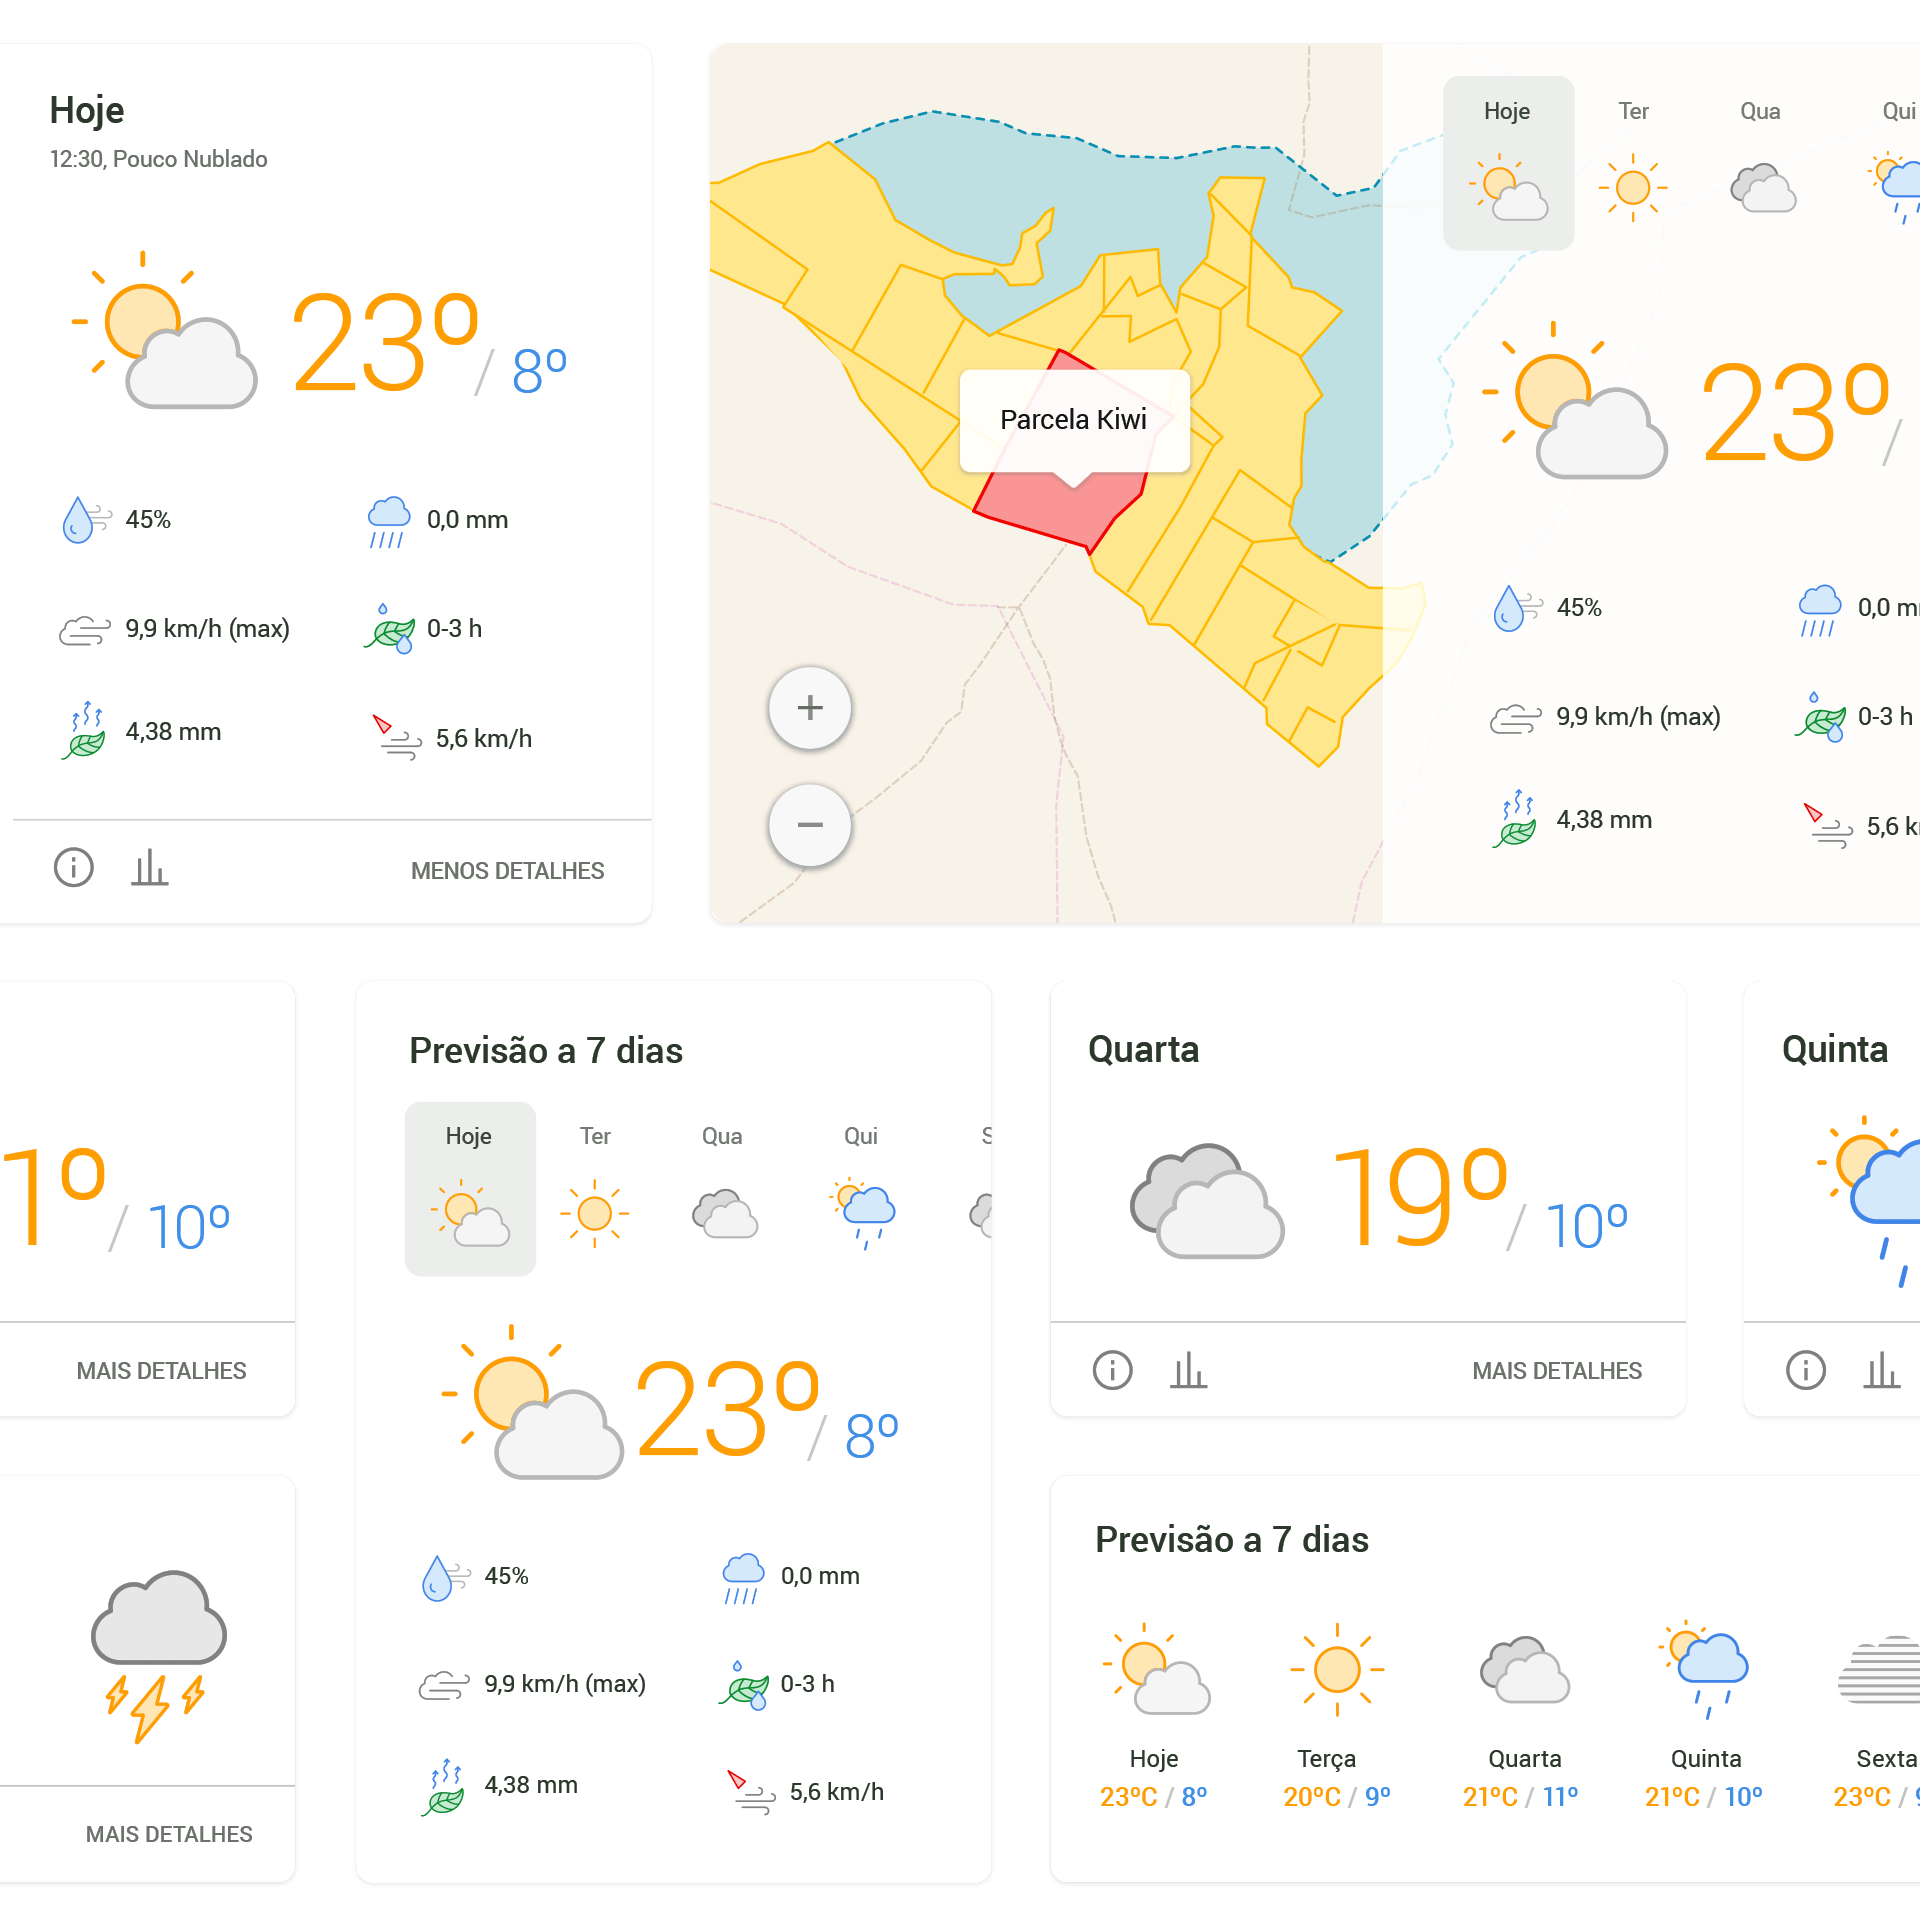
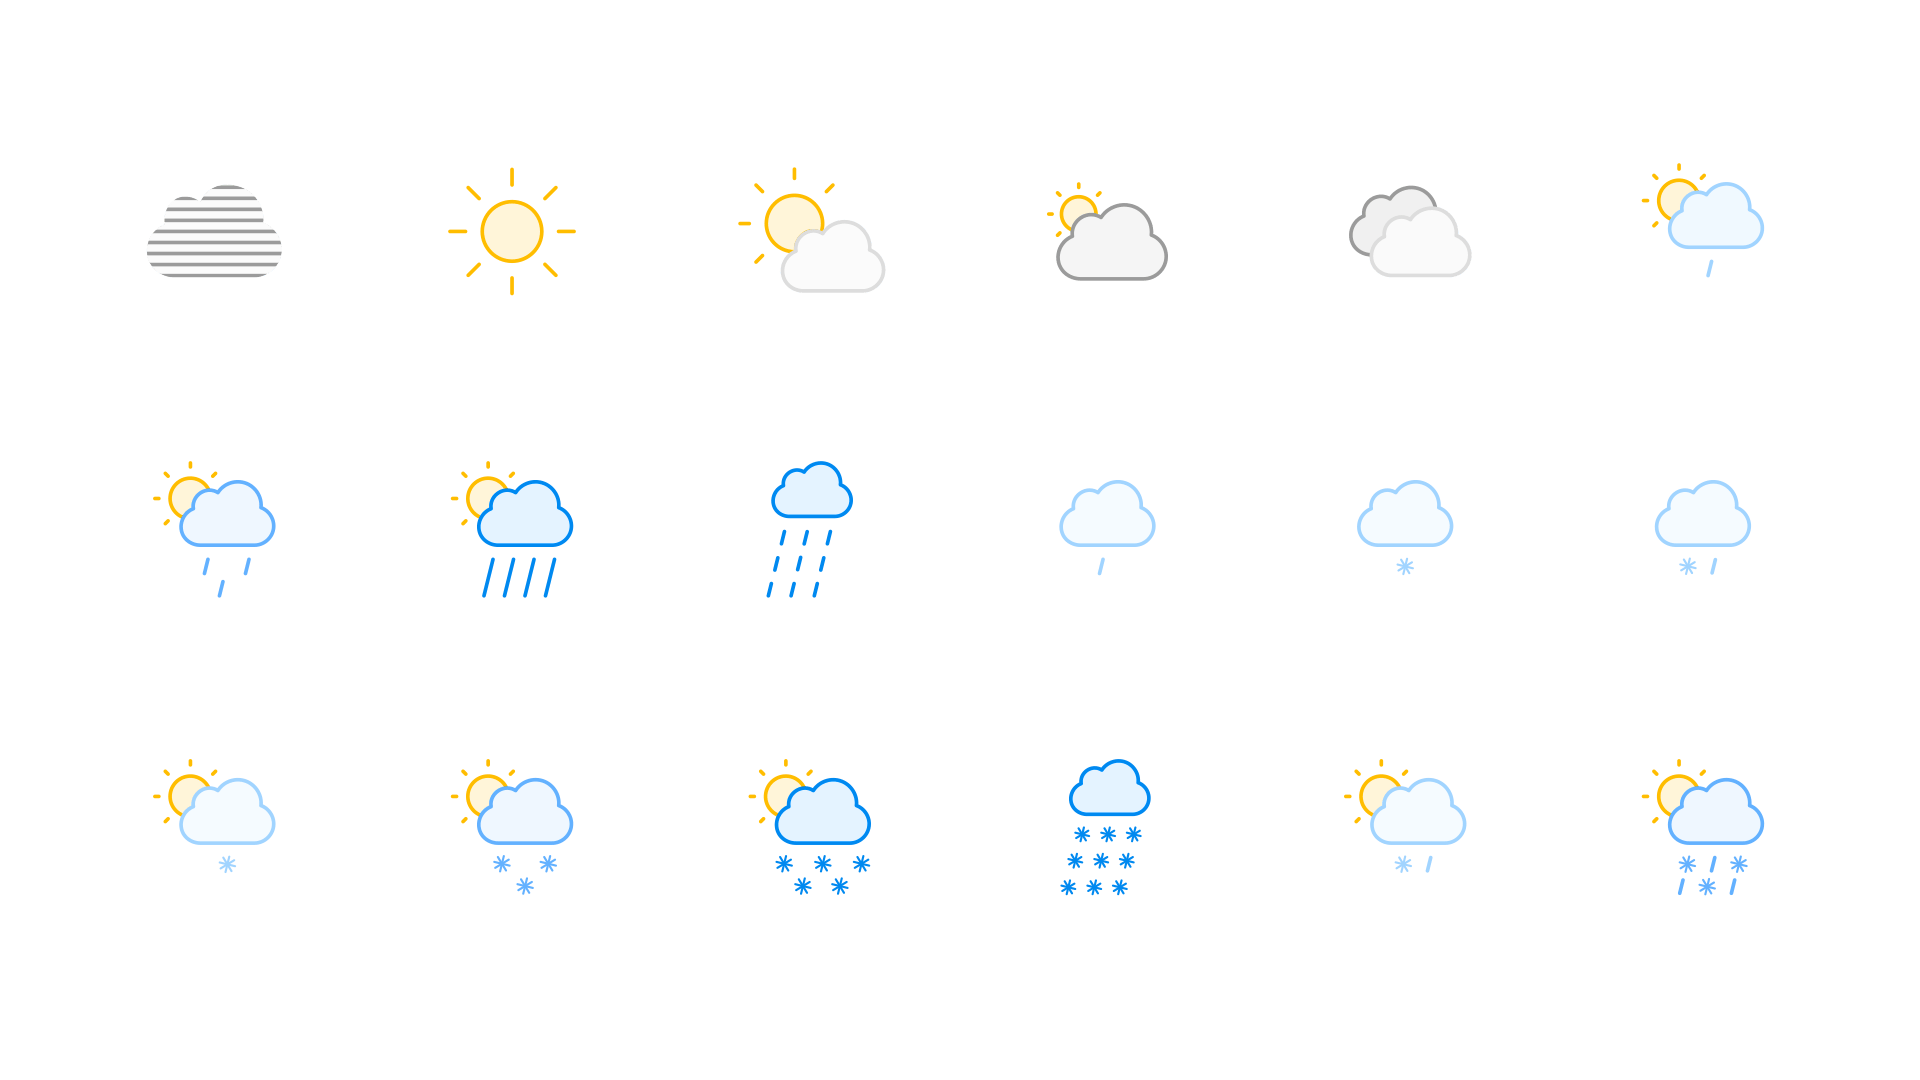
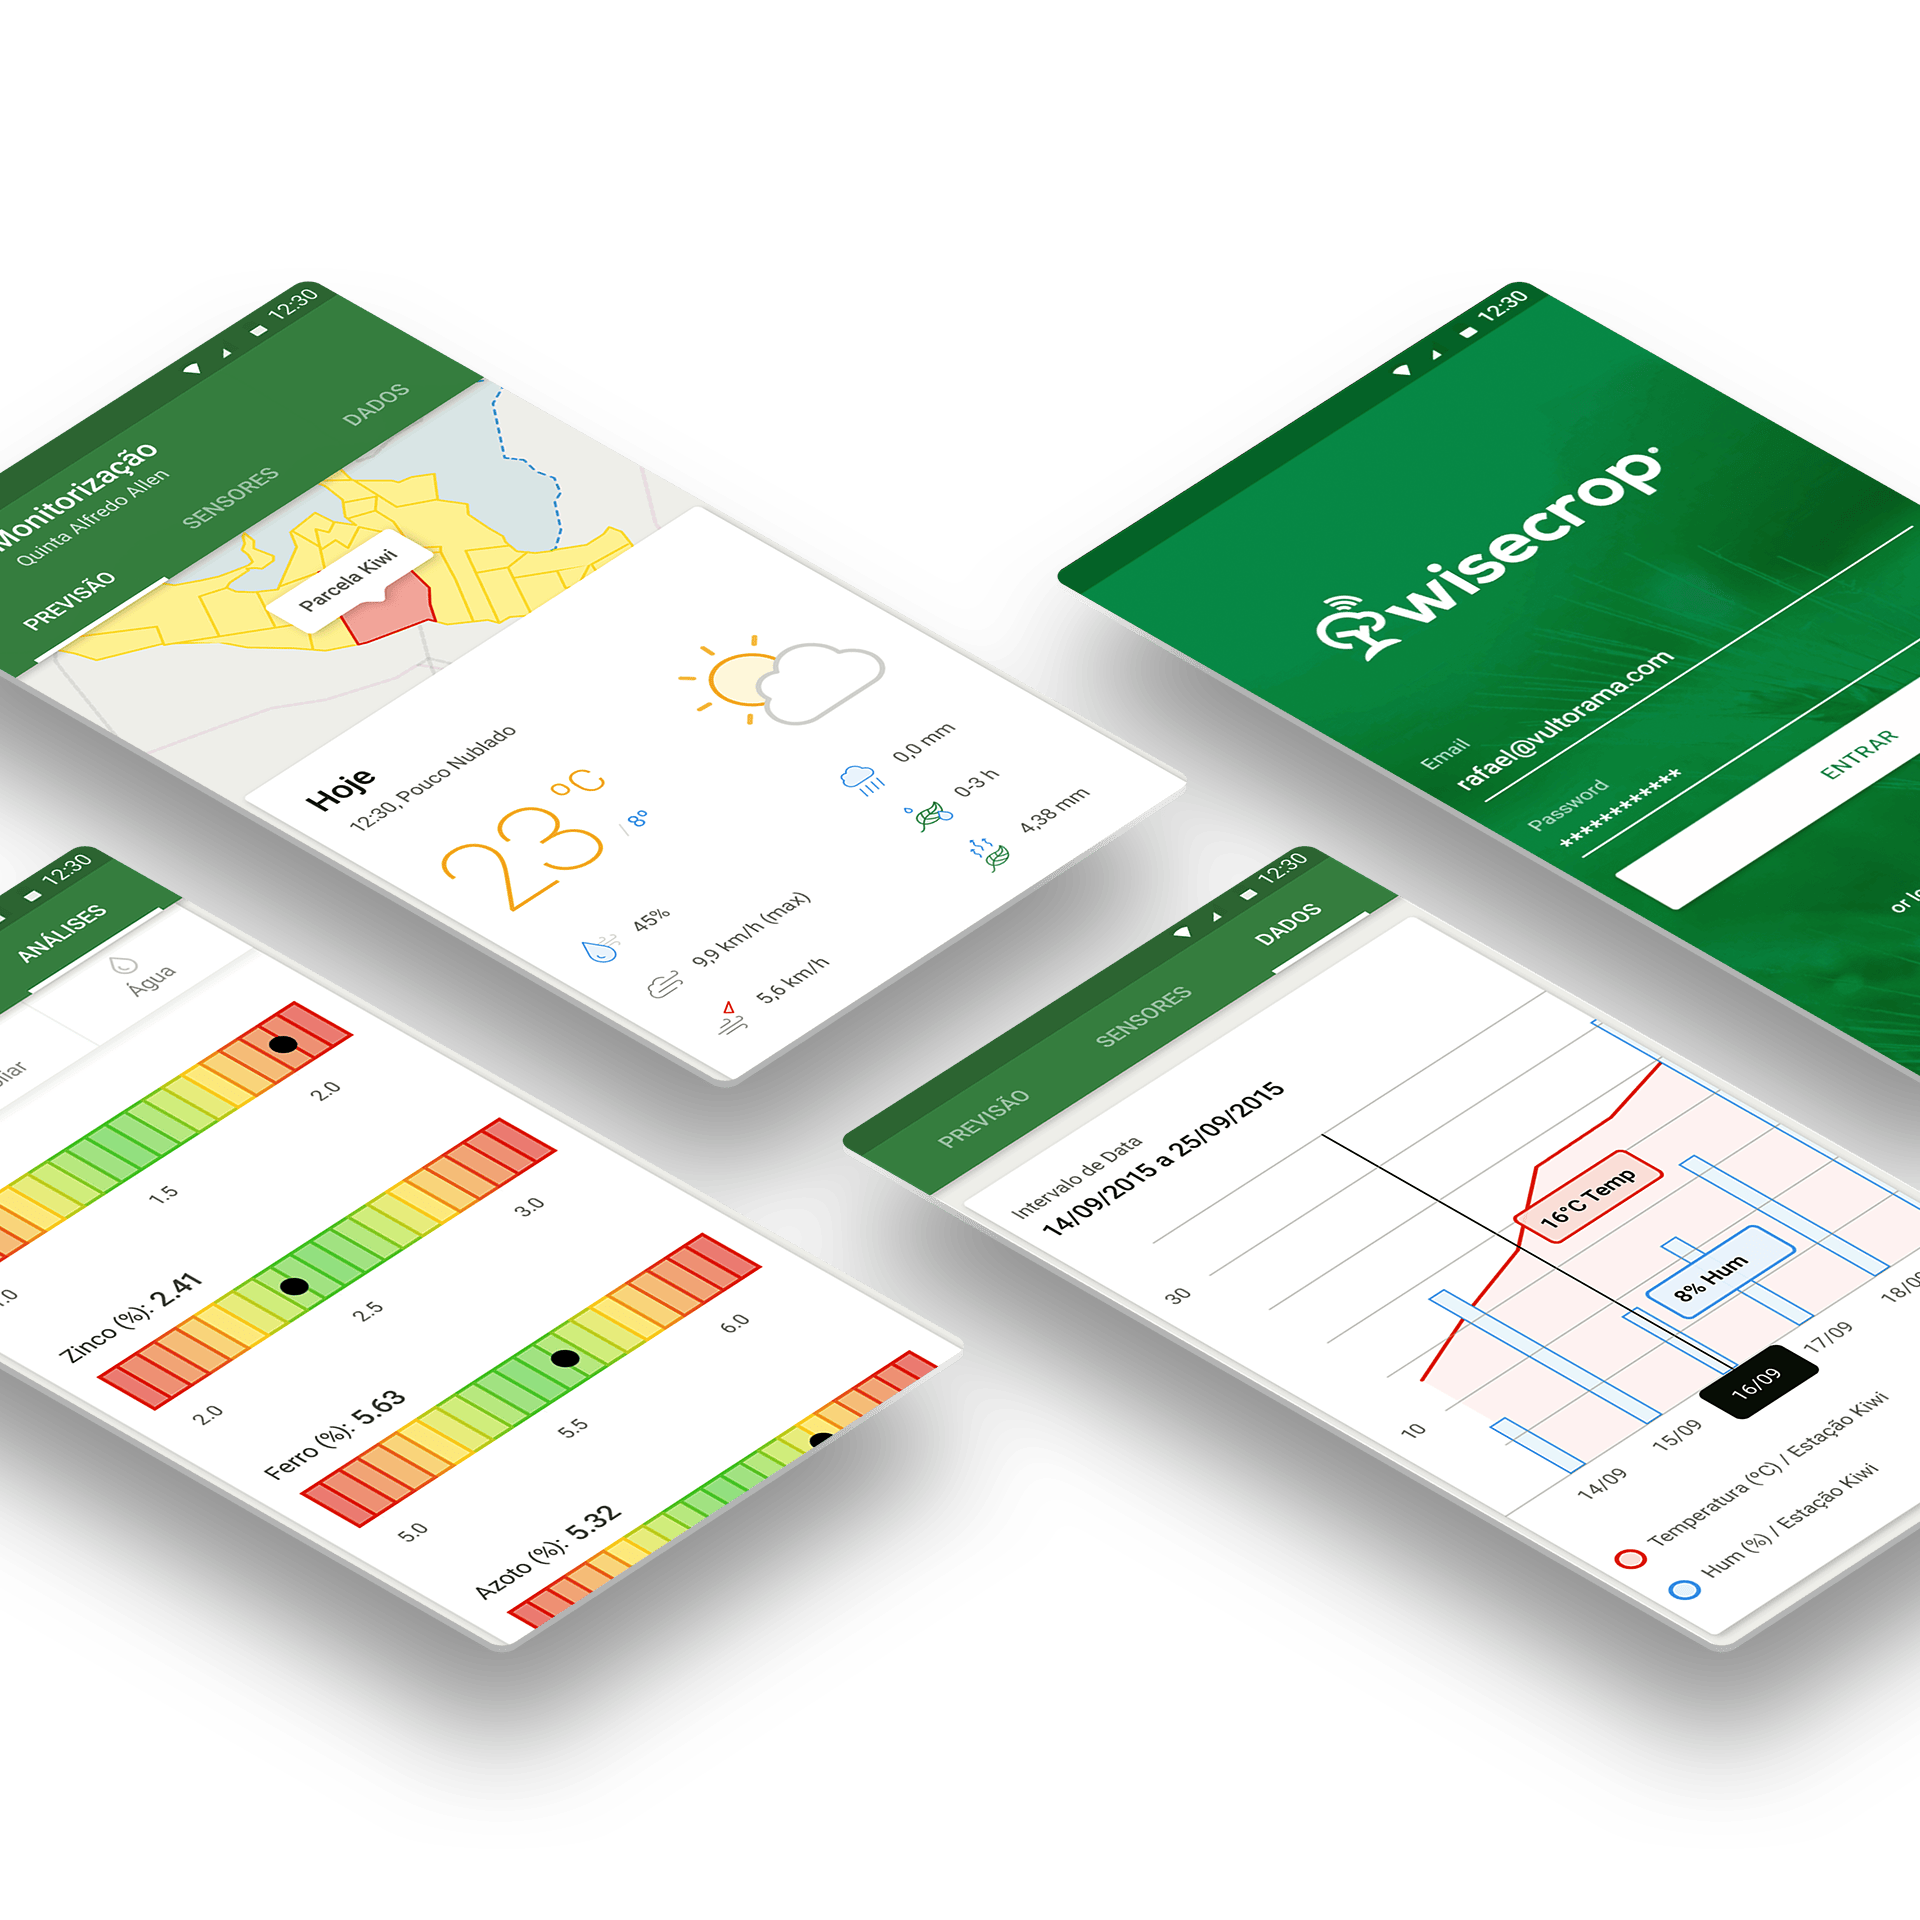
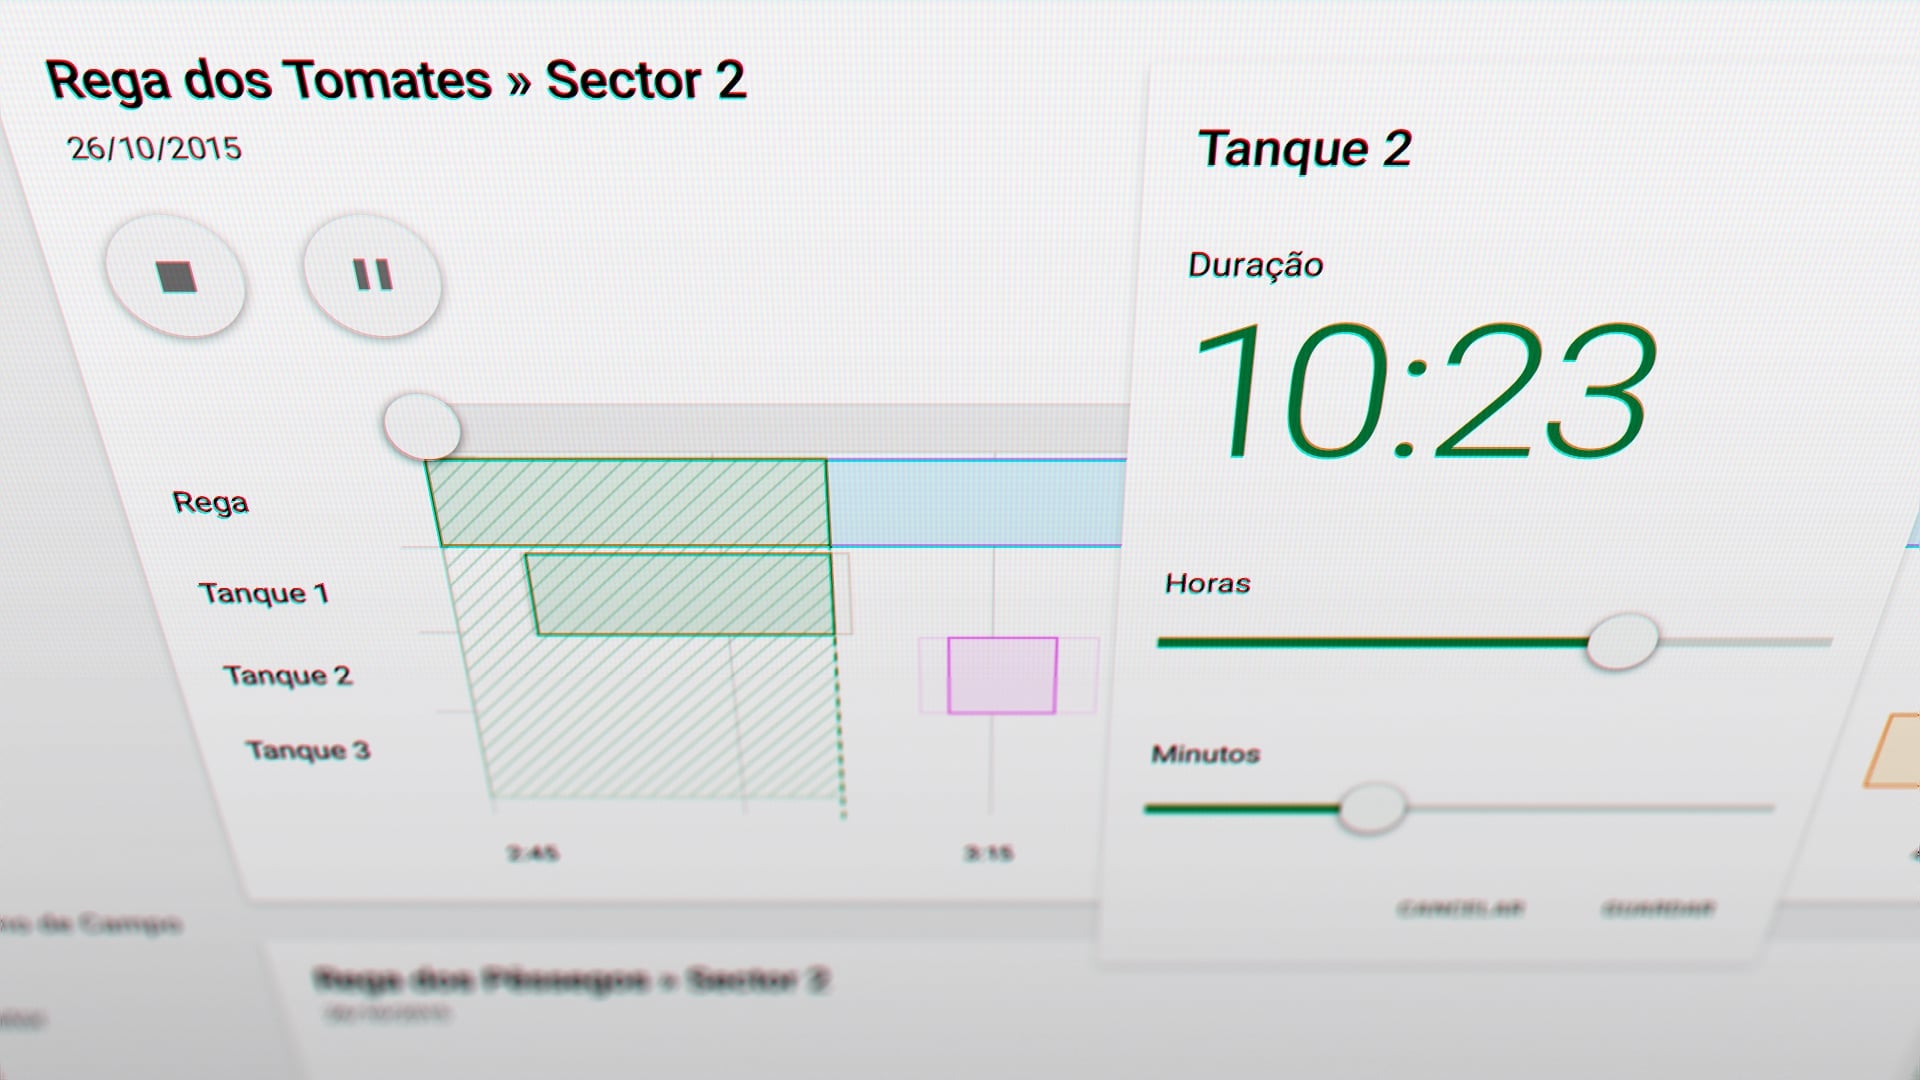
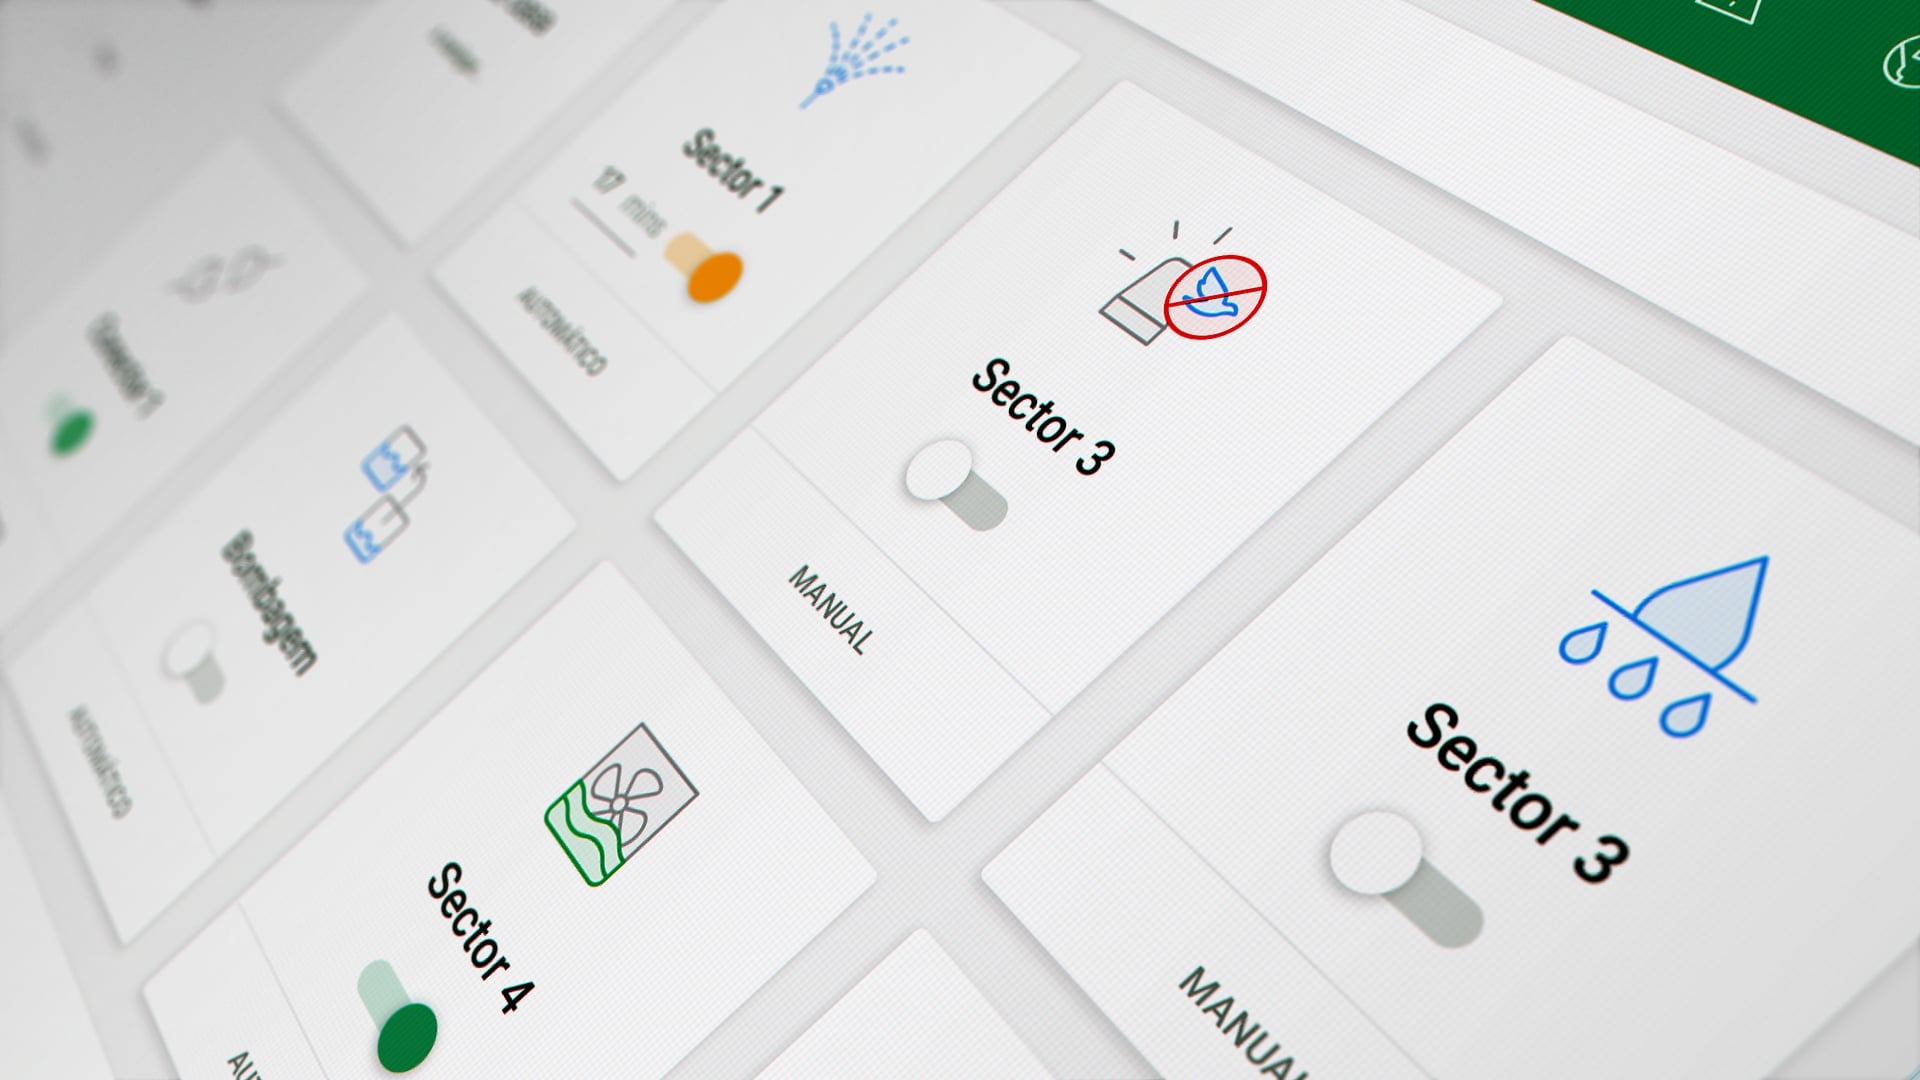
Product UX
Modular Architecture
Product UX
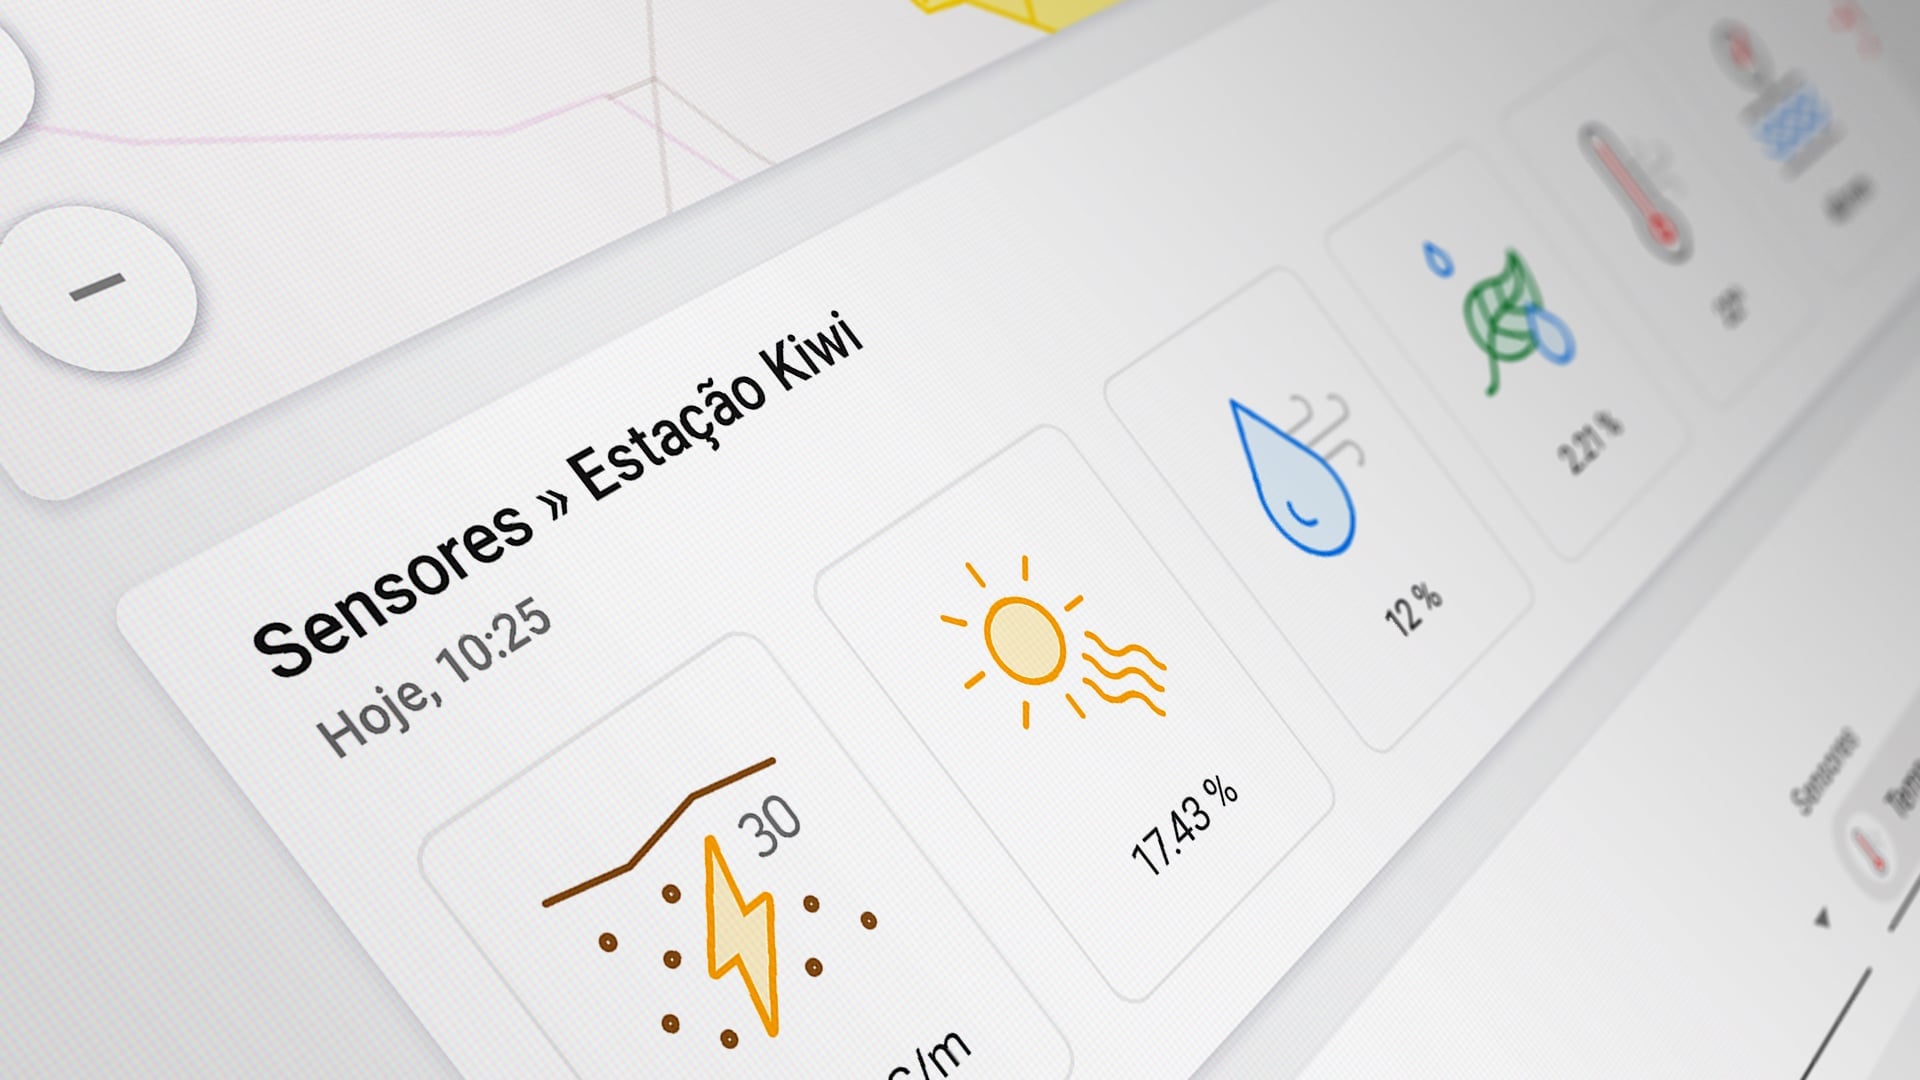
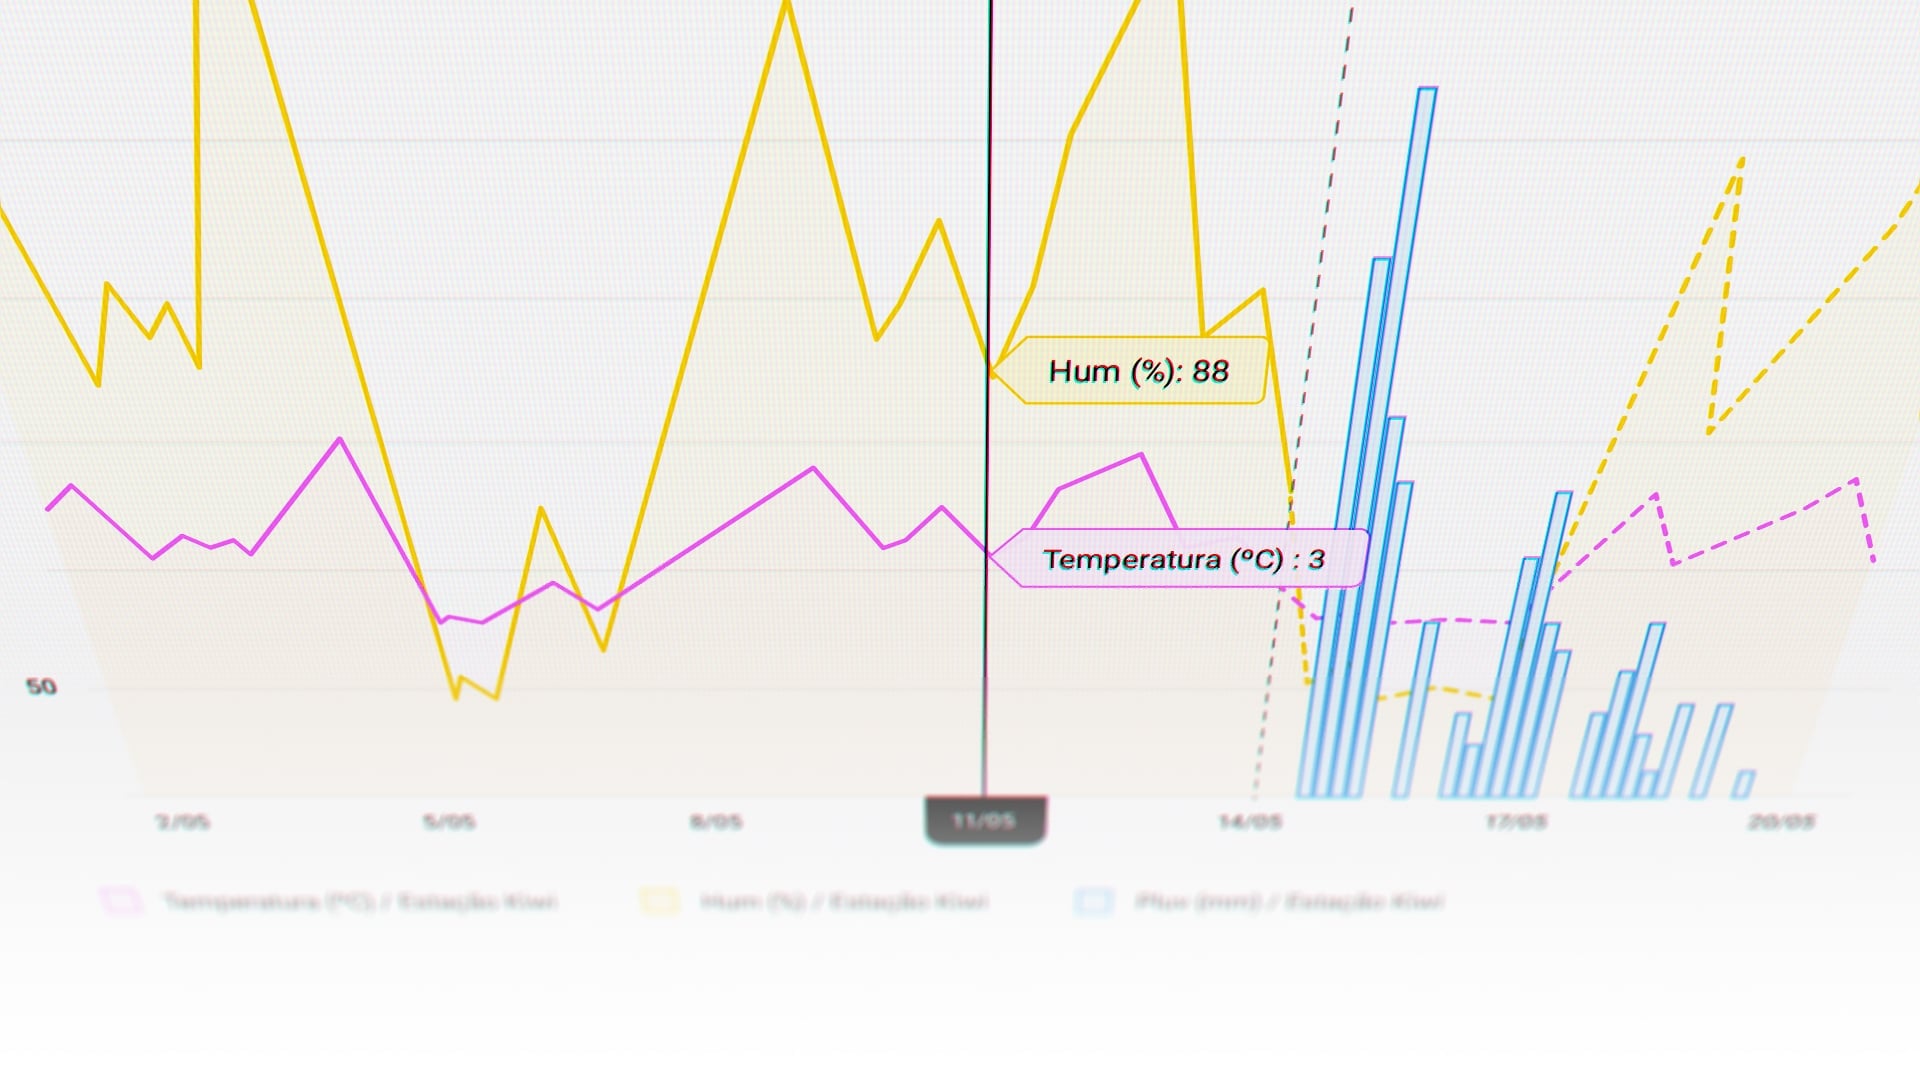
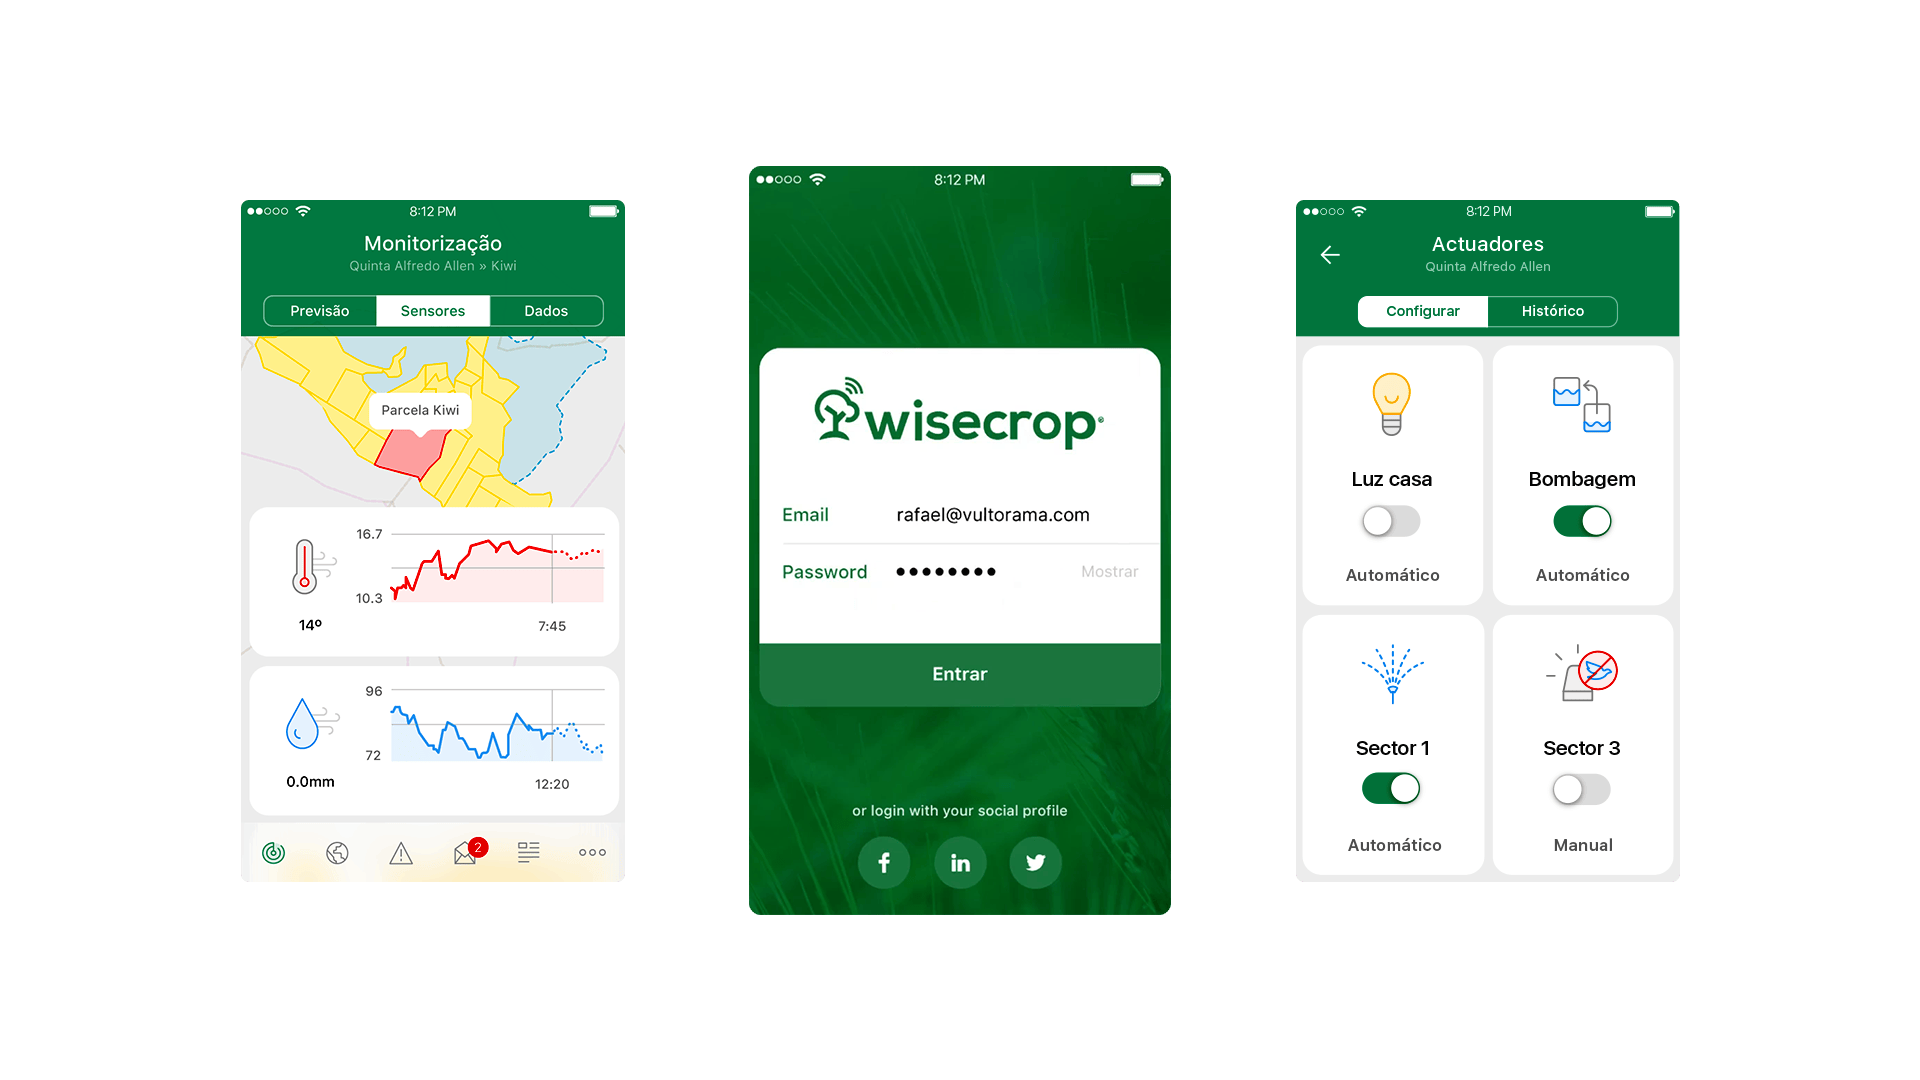
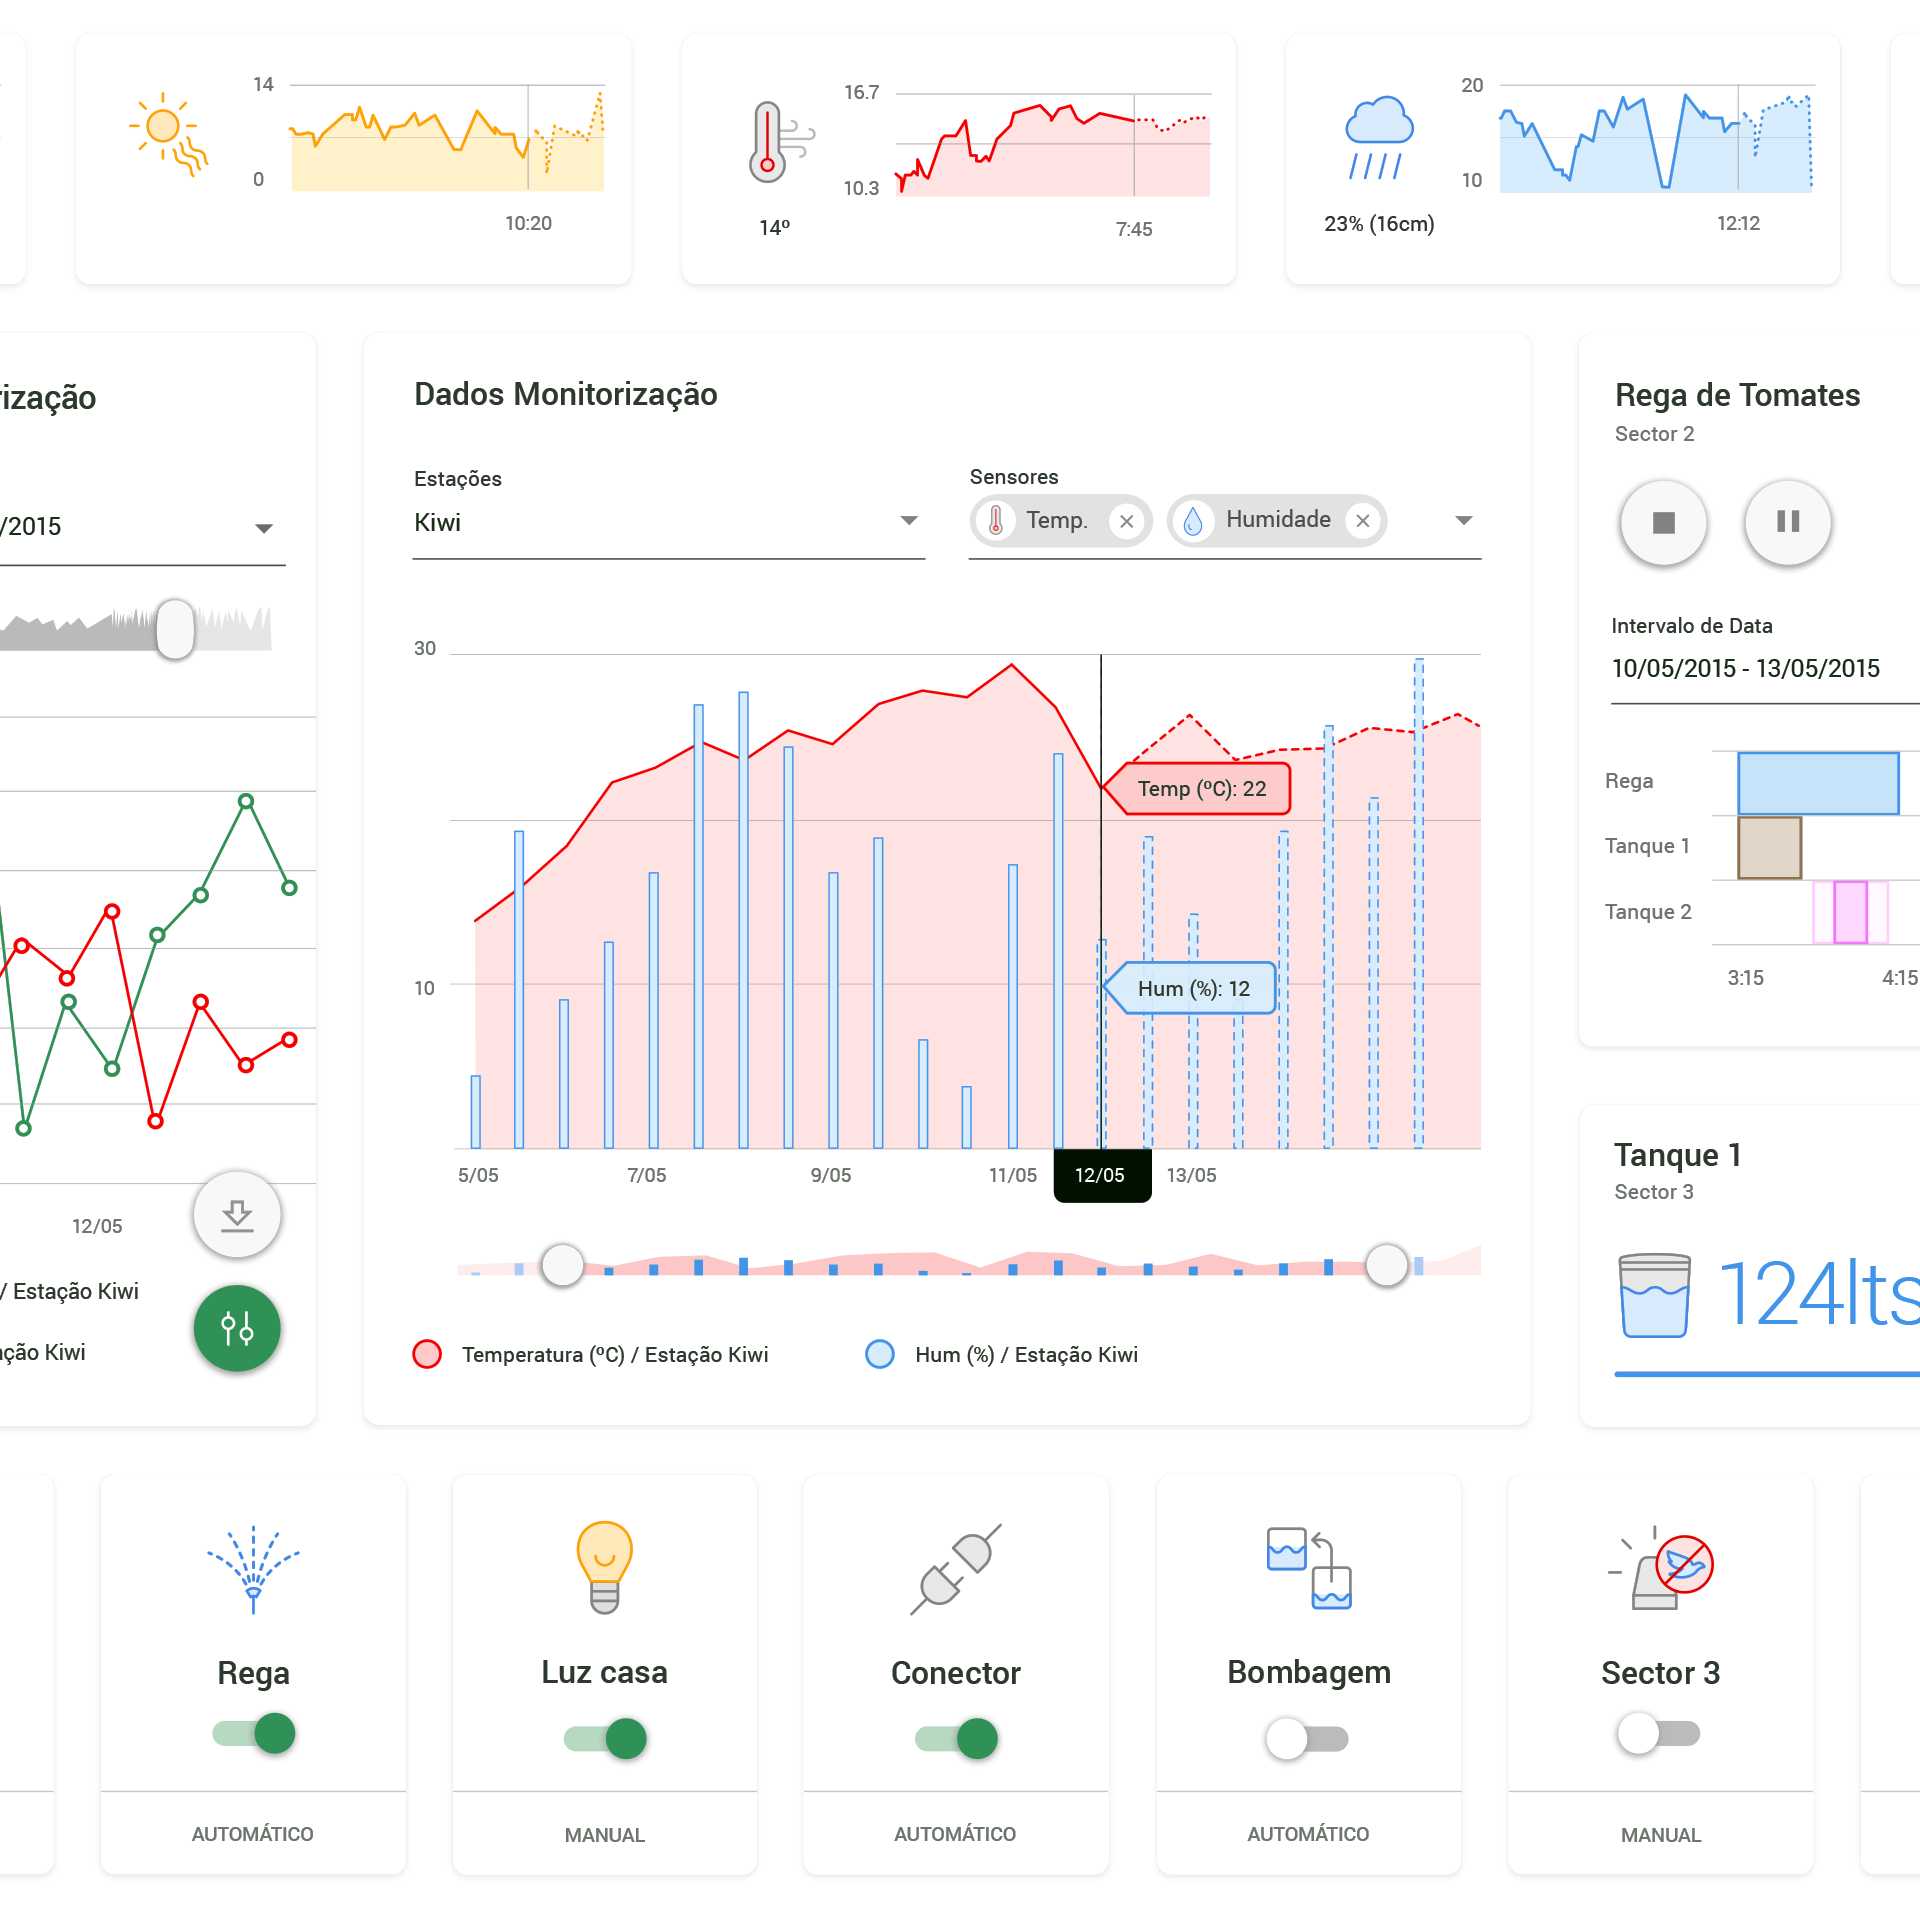
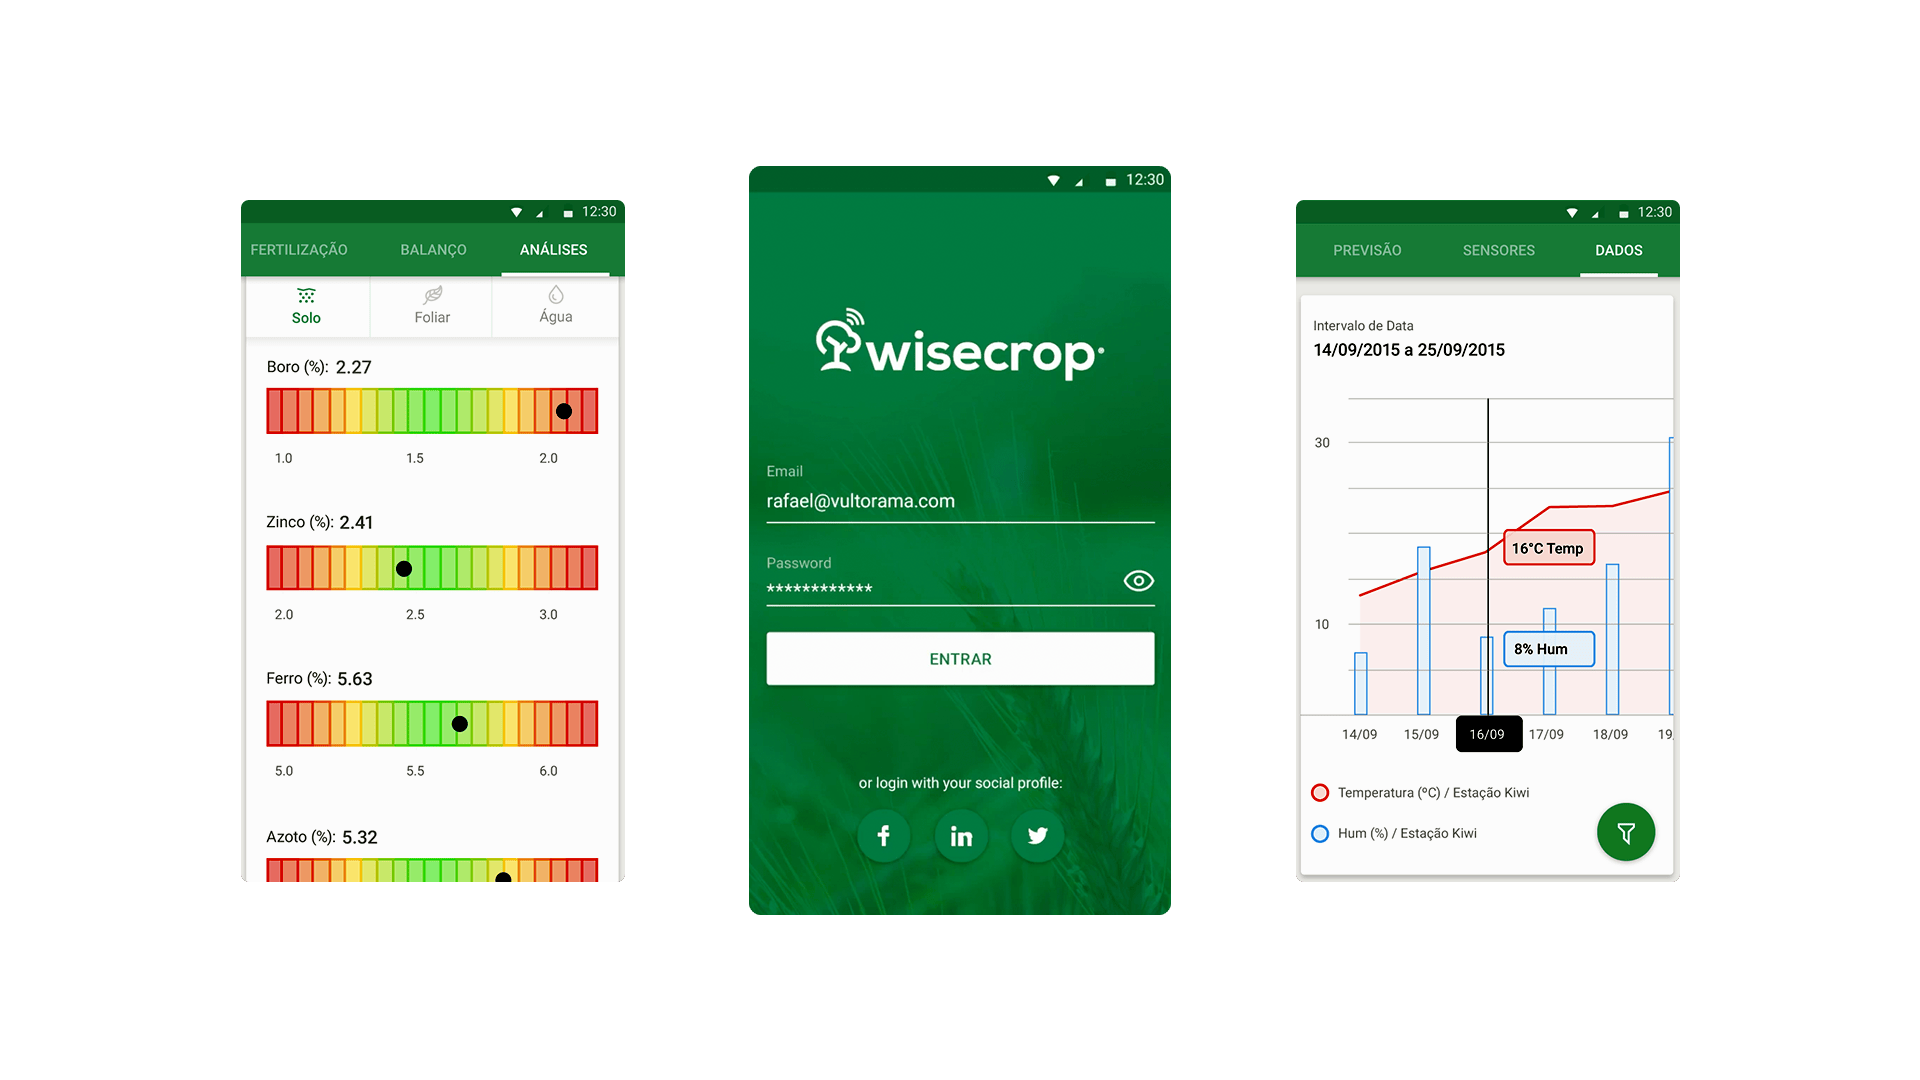
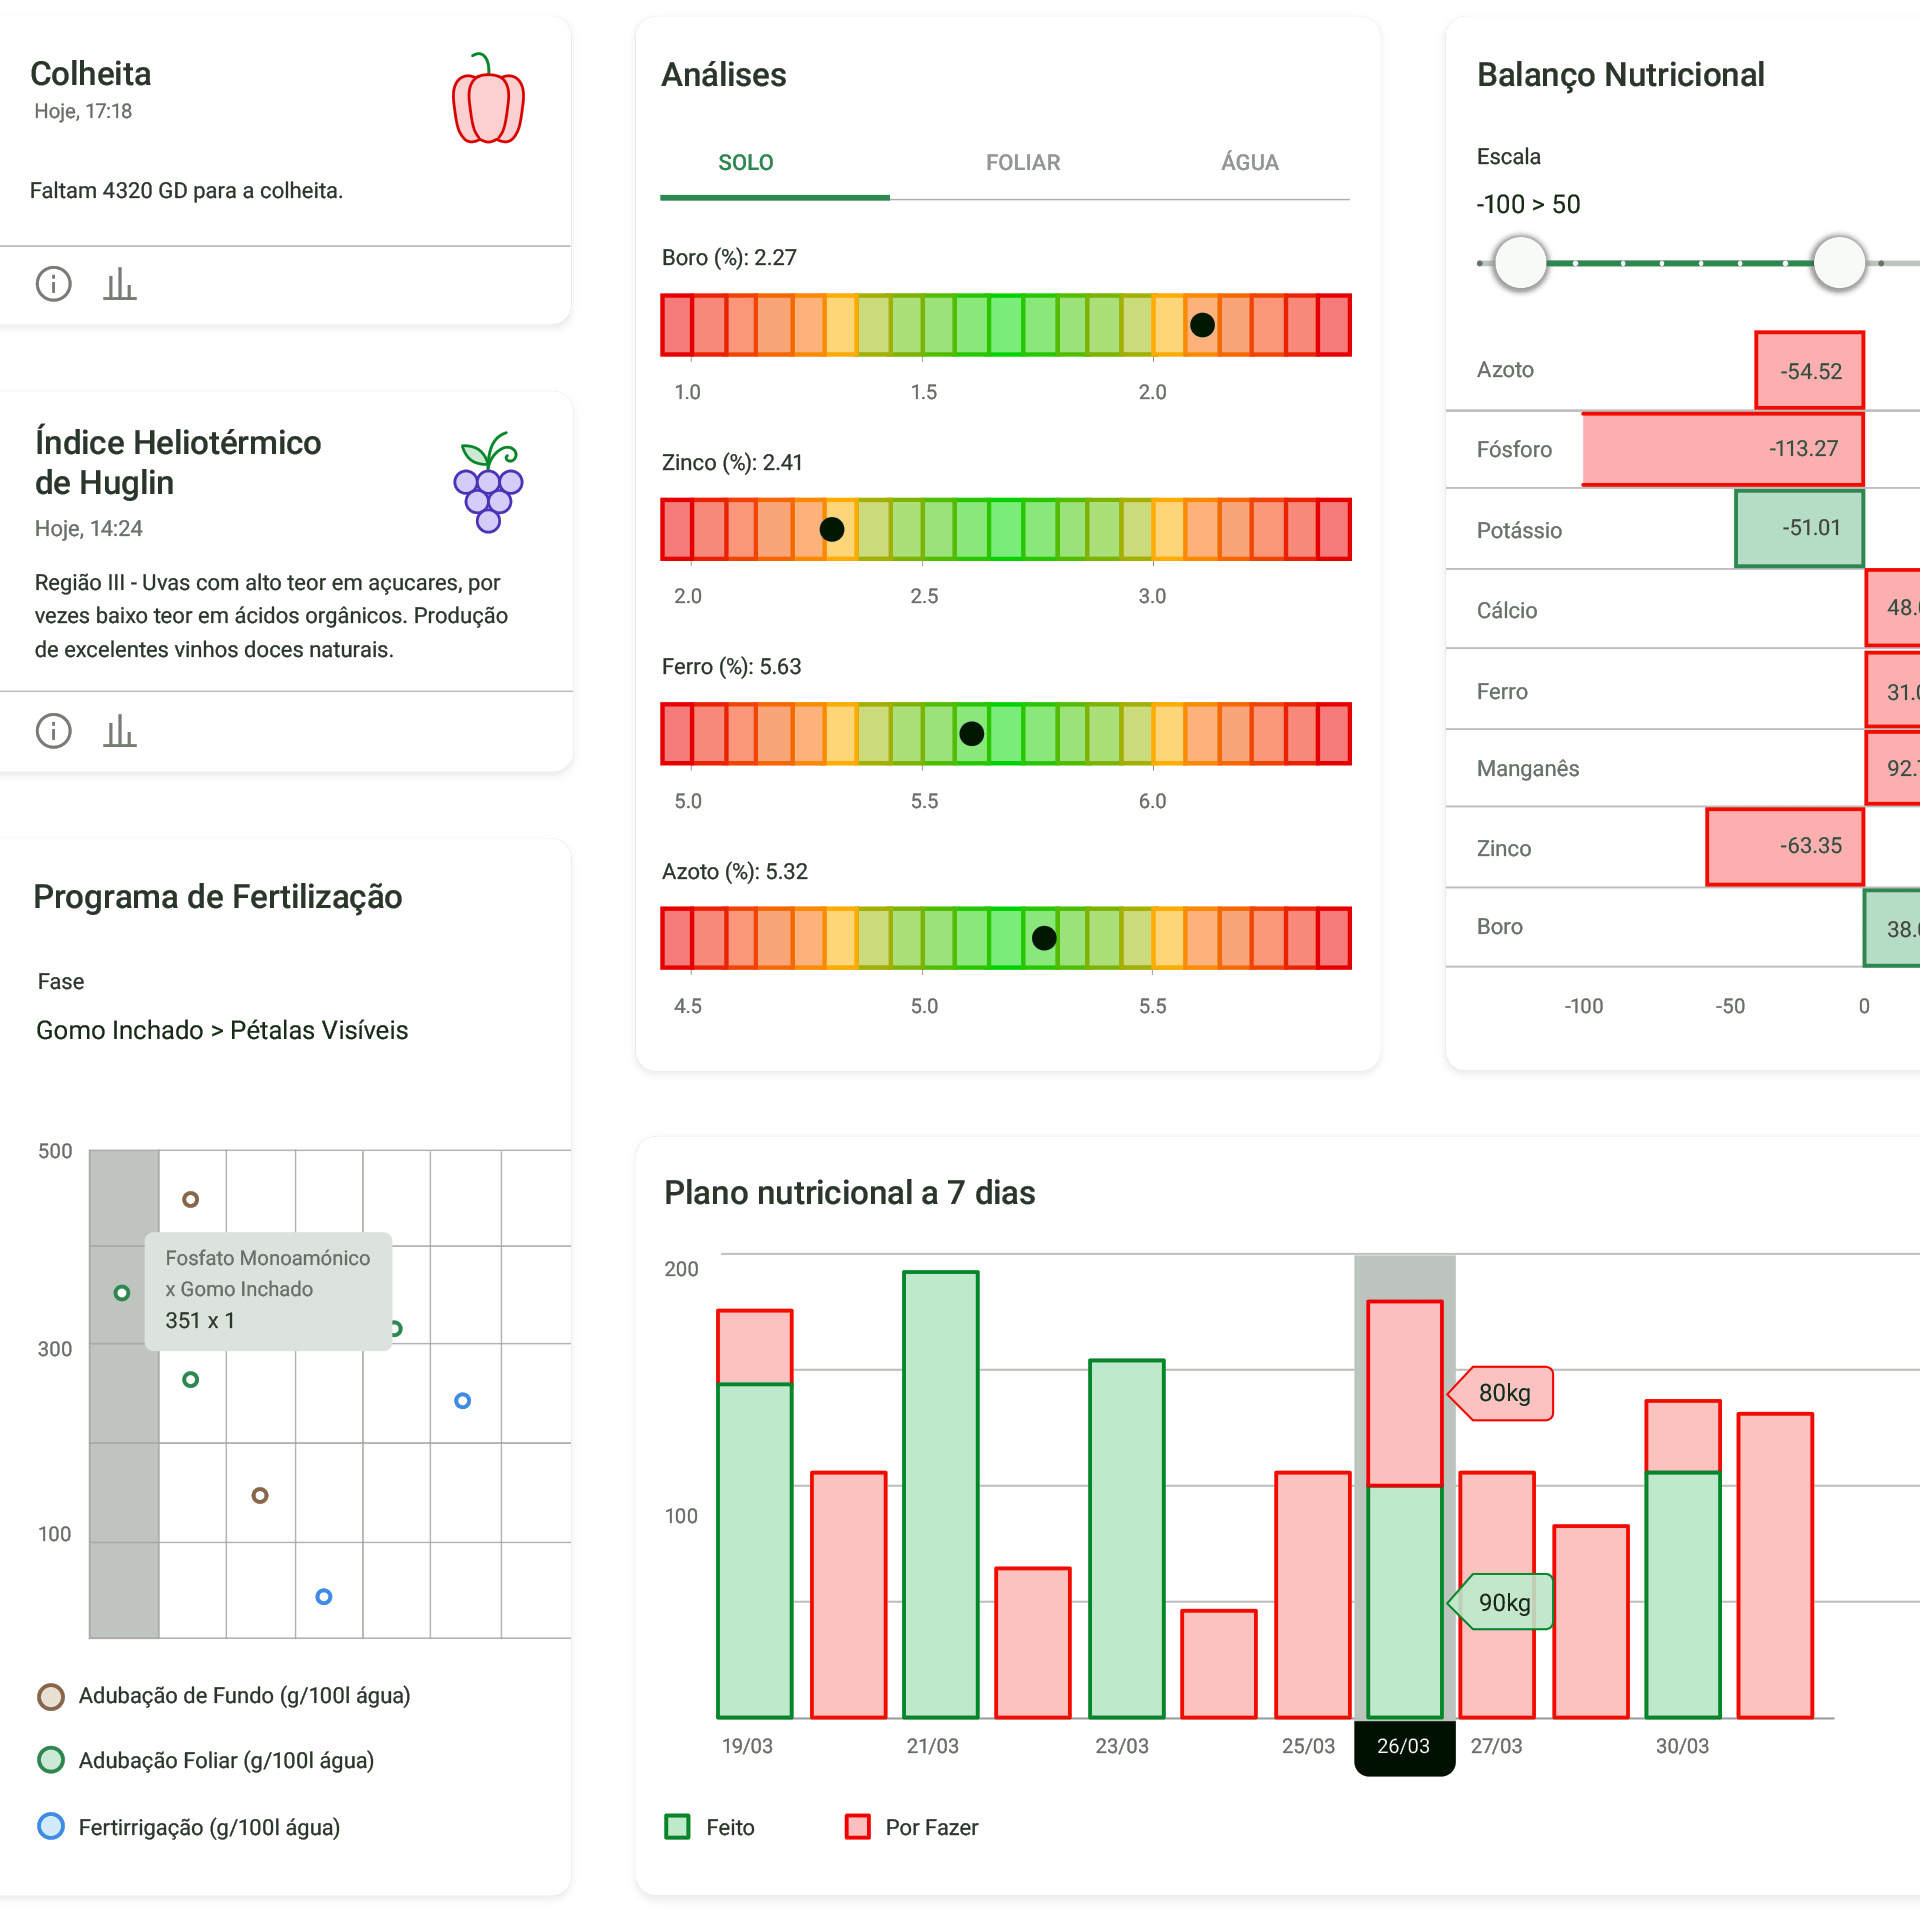
Farm operations run on scattered tools and gut instinct, and Wisecrop is changing that. This agtech company is developing the Agricultural Operating System for ambitious farm operations across weather, irrigation, nutrition, and field management. Getting those tools to behave as one system demands consistency agriculture rarely achieves.
1
Replace scattered tools with one platform farmers trust
2
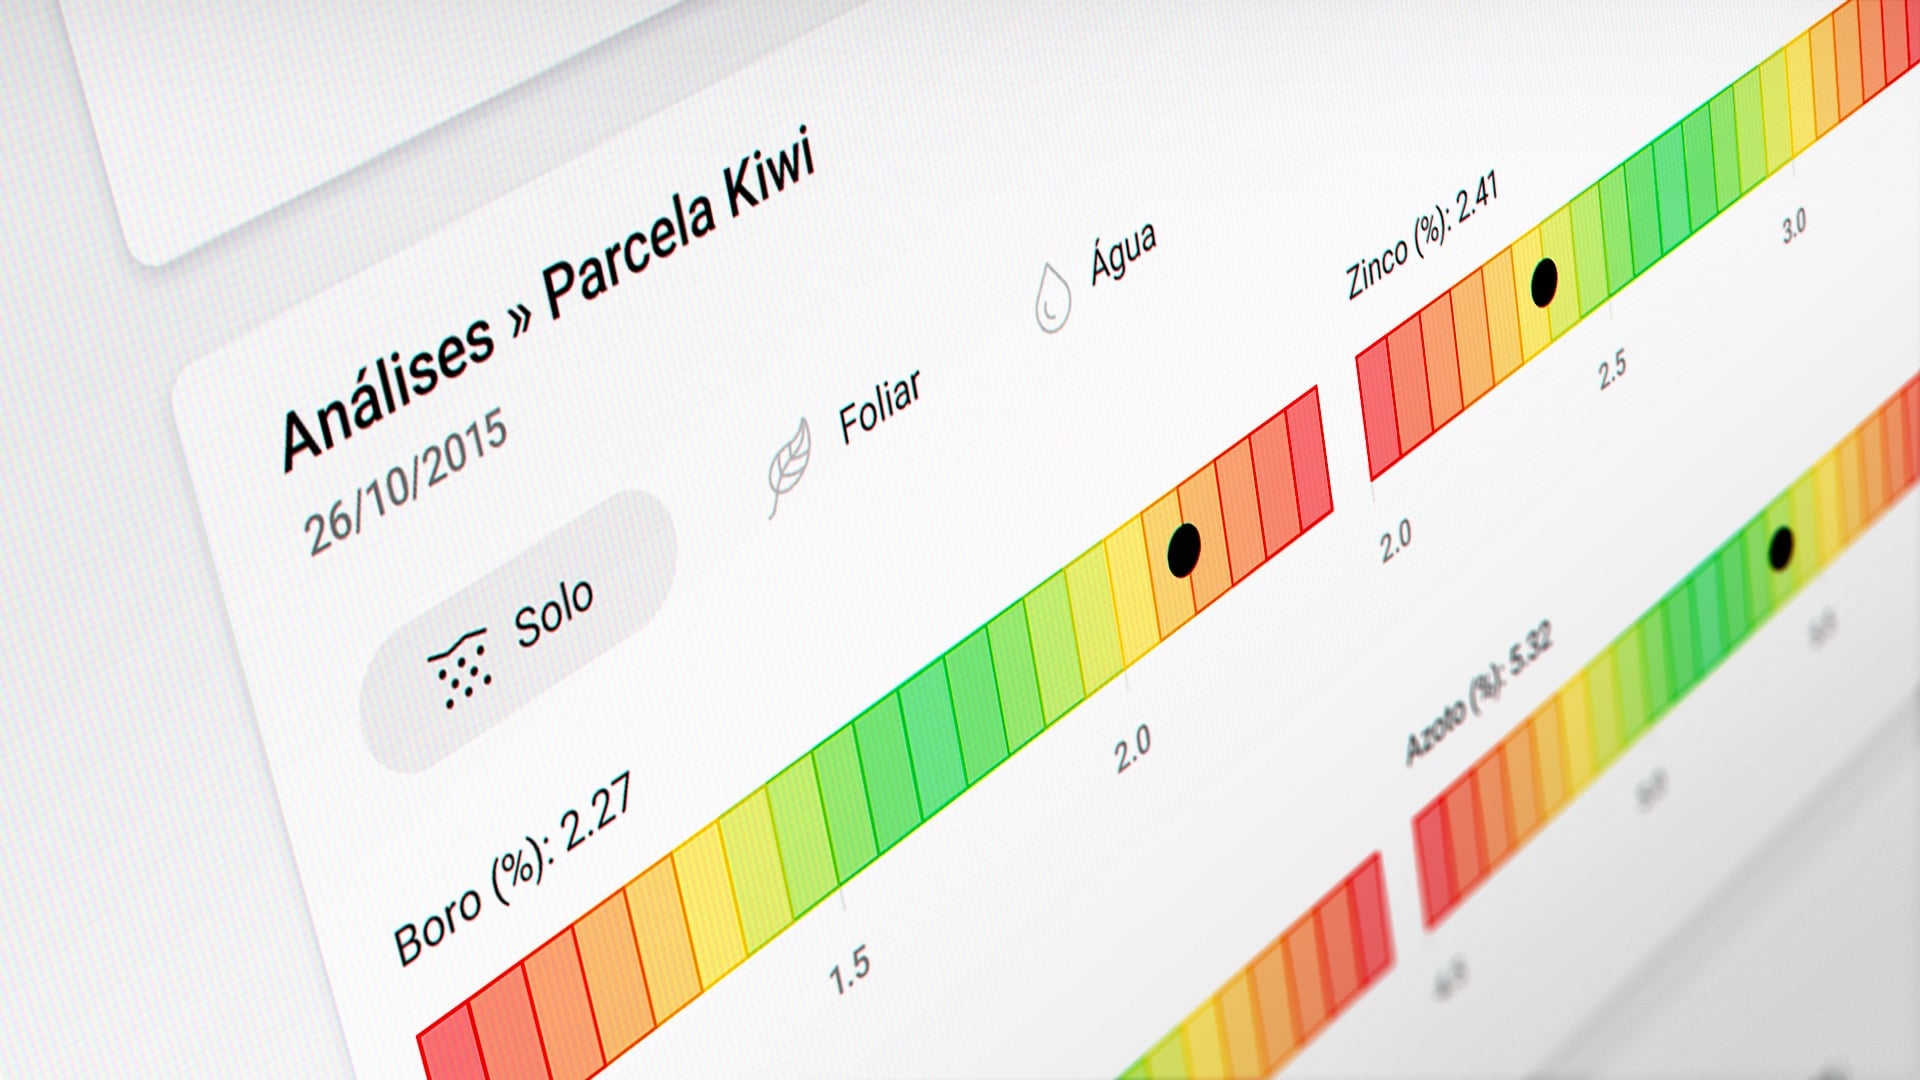
Reach every crop type, farm size, and growing region
3
Expand the platform without slowing down or rebuilding
Product Engineering
Wisecrop
Mobile Engineering
Waterdog

Mobile Engineering
Waterdog

90K+
hectares digitalized

6K+
active farm companies

280+
crops in production
Built close to the farmer
Field demonstrations and trade shows keep Wisecrop grounded in real operational problems, not assumed ones.
We realized success when farmers stopped calling it software and started calling it their farm system.

Tiago Sá
Co-Founder and CEO at Wisecrop
Wisecrop proves that even the most ambitious farm operations don't need to choose between simplicity and precision. Built on a scalable component system, the Agricultural Operating System grows without rebuilding from scratch, in a sector where most platforms still can't keep up.
Modular Architecture
Product UX
Agriculture
Farm operations run on scattered tools and gut instinct, and Wisecrop is changing that. This agtech company is developing the Agricultural Operating System for ambitious farm operations across weather, irrigation, nutrition, and field management. Getting those tools to behave as one system demands consistency agriculture rarely achieves.
1
Replace scattered tools with one platform farmers trust
2
Reach every crop type, farm size, and growing region
3
Expand the platform without slowing down or rebuilding
Product Engineering
Wisecrop
Mobile Engineering
Waterdog
Mobile Engineering
Waterdog

90K+
hectares digitalized

6K+
active farm companies

280+
crops in production
Built close to the farmer
Field demonstrations and trade shows keep Wisecrop grounded in real operational problems, not assumed ones.
We realized success when farmers stopped calling it software and started calling it their farm system.
Tiago Sá
Co-Founder and CEO at Wisecrop
Wisecrop proves that even the most ambitious farm operations don't need to choose between simplicity and precision. Built on a scalable component system, the Agricultural Operating System grows without rebuilding from scratch, in a sector where most platforms still can't keep up.


